A few months ago, an engineering student pointed this graphic out to me. It reveals numbers associated with Florida’s Stand Your Ground law. Now, politics aside (but I think this law is a cesspool of privilege shining through), the graphic is what is of interest for this post. Figure 1 shows how it appeared originally:

By reversing the usual y-axis with a start at 0 (bottom left), this graph has the bottom left as the counted starting point, with 0 at the top of the y-axis, which is completely against all graph-making convention. Over the years, I have seen quite a few crazy graphs, but this one takes the cake. It is an intentional reversal of information, made to lead readers to believe that the “Stand Your Ground” law contributed to a decrease in gun deaths in Florida. The intent of this visual foolery is clear and makes data political by its very reversal of familiar form/visualization.
A reader of Business Insider, P.A. Fedewa, was kind enough to revise this graph, using all of the same numbers, with the y-axis starting at the normalized bottom left, 0 (seee Figure 2). This format, widely used and universally taught, creates a graph that is familiar in form. 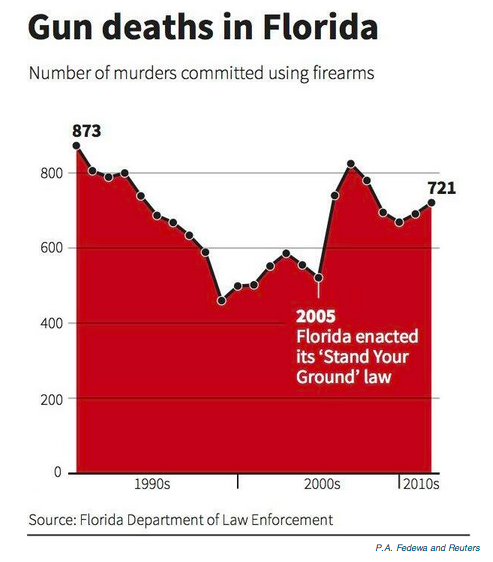
Now, of course, one could argue that this format is equally political…and so it may be. However, the deceit in its visual execution isn’t intention. If there is deceit, it has not been housed in the form of the visualization itself. The numbers are still the numbers. The data still holds true, and the data is provided by familiar visualization that doesn’t take any amount of studying to unpack. By any and all codes of ethics, the original graph fails.

You must be logged in to post a comment.